

Threaded View
-
18-08-2017 05:30 PM #11
- Ngày tham gia
- Mar 2016
- Đang ở
- https://nguyenphuochai.vn/
- Bài viết
- 2,011
- Được cám ơn 3 lần trong 3 bài gởi

Is the U.S. Dollar in the Process of Carving Out a Longer-Term Bottom?
Talking Points:
- Yesterday’s FOMC minutes created another wave of selling in the Dollar. But buyers responded to offer support at another ‘higher-low’.
- The higher-lows that have shown-up in August have built ‘DXY’ into a bear flag formation. If this bullish channel develops further, the potential for a longer-term topside run in the Dollar could look considerably more attractive. Below, we look at two breakout setups for such a scenario, as well as one ‘fade’ setup for those looking for USD-weakness to continue.
In yesterday’s article, we discussed the tenuous nature of the current recovery being seen in the U.S. Dollar. The Dollar came into the month of August extremely oversold, as July was brutal for the Greenback. A solid NFP report at the beginning of the month created a short-squeeze scenario as Dollar shorts hurriedly covered positions. A weak CPI report on the following Friday brought sellers back into the fray, but this time something was missing – and that was bearish drive as we approached those prior lows. As bears got shy near support, prices began to work-higher, solidifying a ‘higher-low’ in DXY as prices ran up to fresh two-week highs.
Yesterday’s FOMC minutes were not inspiring for USD-bulls. The Federal Reserve said that they anticipate starting balance sheet reduction ‘relatively soon’. Some market participants inferred that to mean September, but it’s impossible to determine if this is what the bank was actually implying. Also within the minutes, the Fed discussed worries around lagging inflation. The near-immediate response was another gust of USD-weakness after the Dollar came-off of those fresh two-week highs. But similar to what we saw last Friday, buyers showed-up to offer support at a ‘higher-low’. The chart below shows the U.S. Dollar’s response to yesterday’s FOMC minutes in red, with the most recent iteration of higher-low support in purple.
U.S. Dollar Hourly via ‘DXY’: Bearish Response to FOMC Minutes (in Red)
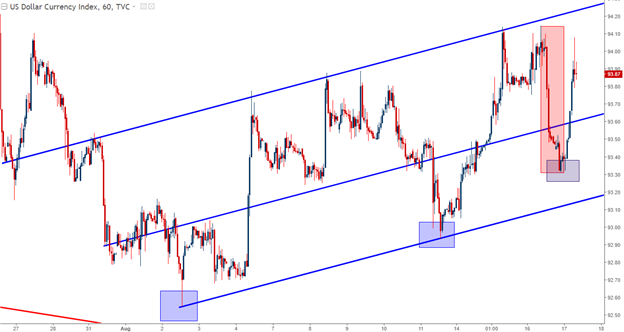
Chart prepared by James Stanley
When taken in consideration of the bigger picture setup in the U.S. Dollar, this makes for a bear flag formation. On the chart below, we’ve added a Fibonacci retracement to the bearish move in DXY that took place in July. From here, we can see where resistance is continuing to show around the 38.2% retracement of that move at 94.06.
U.S. Dollar via ‘DXY’ Four-Hour Chart: Bull Flag with Resistance at 38.2% Fib retracement
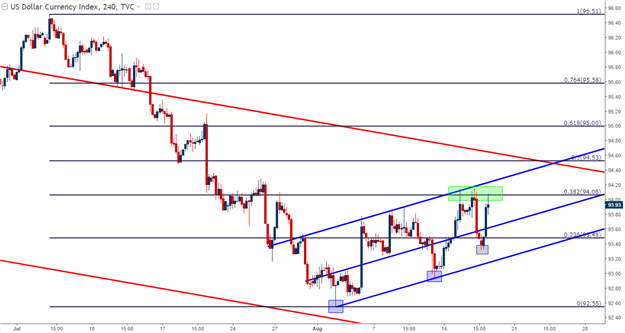
Chart prepared by James Stanley
The exciting part about the above observation is that it appears that the U.S. Dollar is continuing to show bullish indications despite the negative drivers that have shown up over the last week. Friday’s CPI report brought sellers back into the Dollar, but they were unable to perch down to a fresh low. Bullish price action followed, and after yesterday’s FOMC minutes, we saw somewhat of the same as that bearish response was mitigated as bulls came-in at a higher-low.
This opens the potential for a bullish continuation move in the Dollar. This would still be in the extreme early stages, so traders will likely want to be cautious here, but given the continued resistance that’s been seen around the above Fibonacci retracement, a top-side break above this level can also open the door to a bullish break of the bear flag formation. This can create the backdrop with which long USD positions can become attractive again as sentiment shifts from ‘extreme oversold’ levels.
To let this theme build, traders can look for resistance to show around the 50% Fib at 94.53, and this can open up the possibility for ‘higher-low’ support at current resistance around 94.06.
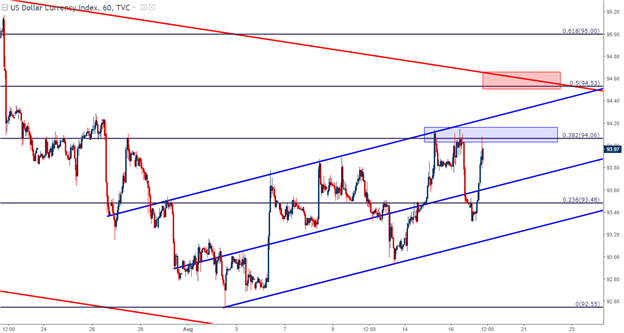
Chart prepared by James Stanley
Bullish Breakout Scenarios in the U.S. Dollar
For traders that do want to look for a top-side move in the Greenback, there are a series of interesting setups available. On the hourly chart below, we’re looking at an inverse head and shoulders formation in USD/JPY. The neck-line around 111.00 could be an interesting topside breakout level to watch in the pair.
USD/JPY Hourly Inverse Head & Shoulders: Neck in Blue, Shoulders in Red, Head in Green
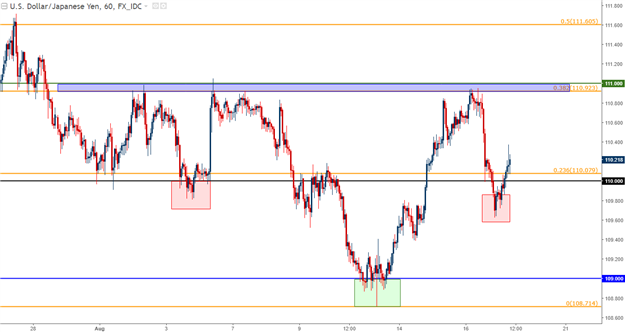
Chart prepared by James Stanley
We’re seeing a similar formation in USD/CHF as it appears that the previous down-trend in the pair is attempting to bottom-out. Resistance of .9770 has held in Swissy since early-June, and multiple attempts to breakout have faltered. Will a subsequent test of that level bring on the same reversal?
If it does not, and if prices are finally able to break above this zone around .9770 – the door can be opened for bullish continuation in the pair.
USD/CHF Four-Hour Inverse Head & Shoulders:Neck in Blue, Shoulders in Red, Head in Green
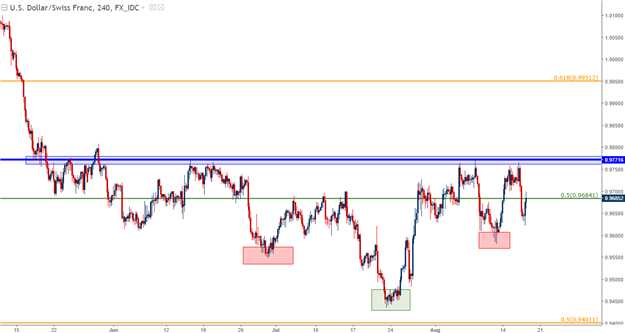
Chart prepared by James Stanley
The Other Side of the Dollar
For those that do not want to look for a larger move of strength in USD, there are setups on the other side. The previously massive up-trend in EUR/USD is continuing to test support, and at this point, it looks like a deeper test may be in store as bears are tip-toeing lower on the chart. Of recent, we’ve been discussing the big picture zone of support in the pair that runs from 1.1685-1.1736. At 1.1685 we have the 23.6% retracement of the 2008-2017 major move, and at 1.1736 we have the 38.2% retracement of the ECB QE move in the pair.
EUR/USD Monthly Chart: After a Bullish 2017, Long-Term Support Zone Continues to Test
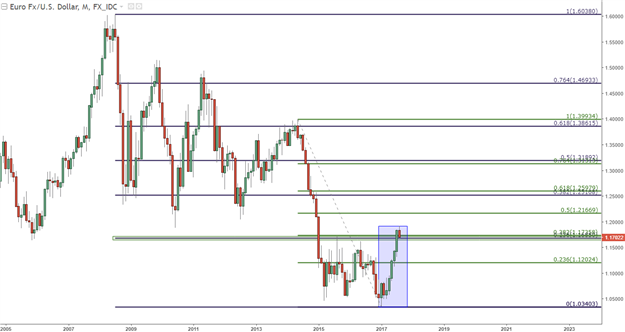
Chart prepared by James Stanley
On the shorter-term four-hour chart below, we can see where EUR/USD continues to tip-toe below this support zone. This retracement is still very shallow, as we haven’t yet taken-out 38.2% of the recent bullish move in the pair (shown in royal blue below). It would appear that we have the beginnings of a bull flag formation starting to show, which could see a deeper retracement before the bullish move is ready to continue. But this can open the possibility of a few different points of reference for the topside continuation setup in EUR/USD.
A break-above 1.1800, or a deeper support test around 1.1607 or 1.1500 can open the door to bullish setups in EUR/USD.
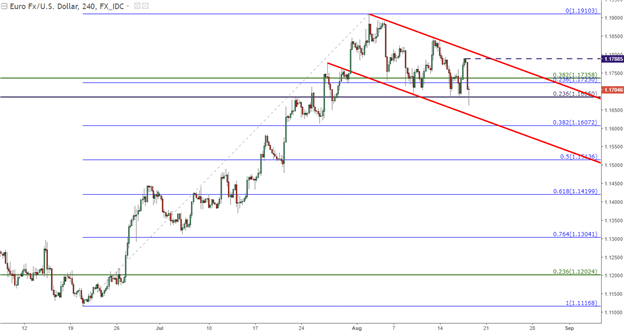
Chart prepared by James Stanley
--- Written by James Stanley, Strategist for DailyFXWebsite : https://nguyenphuochai.vn//
Mở TK HotForex: https://www.hotforex.com/?refid=116627
Mở TK Axitrader: https://goo.gl/iTGLce
Mobile : 0908950768 - Zalo - Viber
Không chia sẽ là hủy diệt- Sơn SVT
Tâm trạng không tốt-không trade ; thể trạng không khỏe -không trade


 Trích dẫn
Thông tin của chủ đề
Users Browsing this Thread
Có 1 thành viên đang xem chủ đề này. (0 thành viên và 1 khách vãng lai)
Similar Threads
-
Phân tích thị trường mỗi ngày cùng instaforex!
By InstaForex Dane in forum Forex và Hàng hóaTrả lời: 54Bài viết cuối: 08-06-2018, 01:53 PM -
Report Phân tích Cung cầu.... & Tín hiệu BBs.... hàng ngày....!!!!
By mayhong in forum Nhận định Thị trườngTrả lời: 17Bài viết cuối: 09-03-2010, 03:04 PM
 Quyền viết bài
- Bạn Không thể gửi Chủ đề mới
- Bạn Không thể Gửi trả lời
- Bạn Không thể Gửi file đính kèm
- Bạn Không thể Sửa bài viết của mình

Bookmarks